Telemetry - Application Architecture
Event Architecture Overview
The Xavier telemetry system uses an event-driven architecture where all metrics are captured as structured events with rich metadata. Each event is published to a message bus (Kafka/Azure Event Hubs) and then stored in both operational (PostgreSQL) and analytical (ClickHouse) databases for different query patterns.
Core Event Structure
json
{
  "event_id": "uuid",
  "event_type": "string",
  "timestamp": "ISO 8601 datetime",
  "tenant_id": "uuid",
  "user_id": "uuid",
  "session_id": "uuid",
  "source": "string",
  "version": "1.0",
  "metadata": {},
  "tags": {}
}
Event Overview Table
| Event | Service | Channel | Purpose |
|---|---|---|---|
Event Relationships & Dependencies
Primary Execution Flow
JOB_QUEUED → JOB_ASSIGNED → MODEL_EXECUTION_STARTED → CHECKPOINT_LOADED → MODEL_EXECUTION_COMPLETED/FAILED → COST_ALLOCATION
Infrastructure Events
Checkpoint Management Flow
Enrichment of events about tasks performed by XUMI
- Telemetry service listens to kafka for events.
- When a “xumi.generation.finish” event appears in kafka stream, the service extracts TaskId, UserId, NodeId, TenantId, Start & Finish time.
- Request to Prometheus to receive node's metrics in period.
- When metrics are received the service analyzes and aggregates them, and saves them in its storage.
The Telemetry service also provides an API for querying stored metrics.
User Quota Service
Xavier | Audit and Telemetry TDD, v2.0
System components
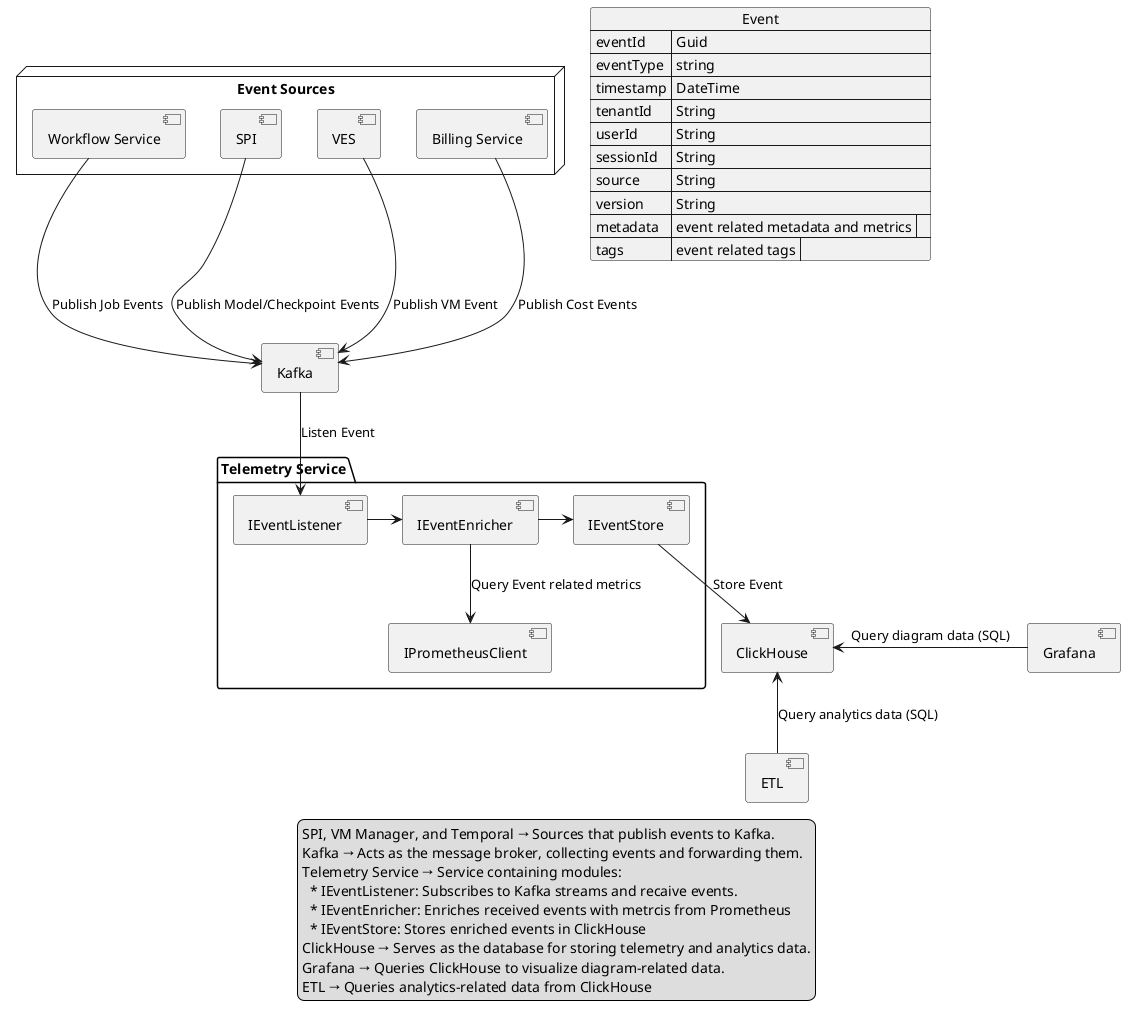
The main components of the system are:
Event Sources
External services (XUMI, Workflow Service, Billing Service) that produce events necessary for collecting telemetry data.
- Microservices
- Microservice-dependent events
- Kubernetes
- Node Start
- Stopping the node
- How do I get the machine start event and the configuration of what started?
- Starting the feed
- Stopping the hearth
- Kubernetes API
- Prometheus
- Export data about GPU\CPU\RAM\HDD
Kafka
A distributed event streaming platform. It acts as a buffer and router for telemetry events. Kafka decouples producers (event sources) from consumers (processing services), allowing scalable and fault-tolerant event ingestion.
Telemetry Service
Telemetry Service is responsible for enriching events with event related Prometheus metrics and storing them in ClickHouse. The service consists of the following modules:
IServiceListener - responsible for subscription to Kafka events.
IEventEnricher - responsible for enriching events with related Prometheus metrics.
IEventStore - responsible for storing events in ClickHouse.
IPrometheusClient - responsible for querying Prometheus metrics.
Grafana
Responsible for telemetry diagram visualization. Queries diagram data from ClickHouse.
Activities
| Component | Role |
|---|---|
| Event Sources | External systems that generate events |
| Kafka | Message broker for event delivery |
| Telemetry Service | |
| ClickHouse | Final storage for enriched events |
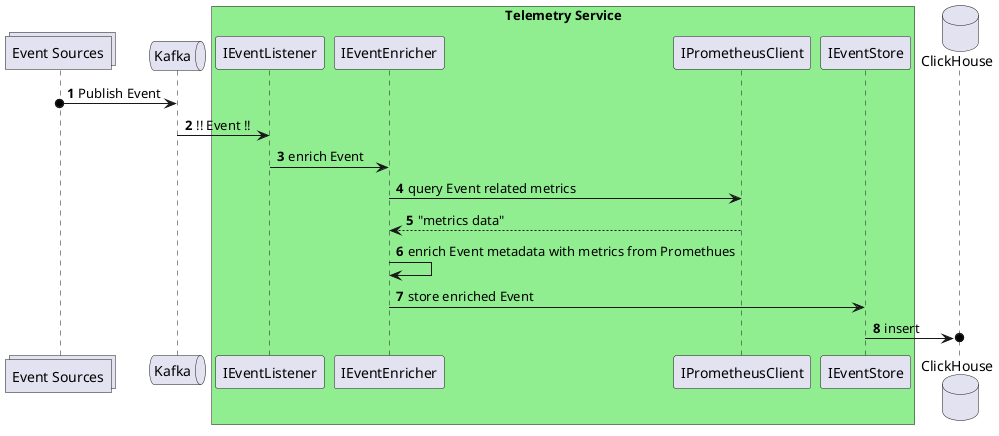
Inside the Telemetry Service box:
IEventListener: Listens for incoming events from KafkaIEventEnricher: Adds metadata and metrics to eventsIPrometheusClient: Queries Prometheus for metricsIEventStore: Persists enriched events
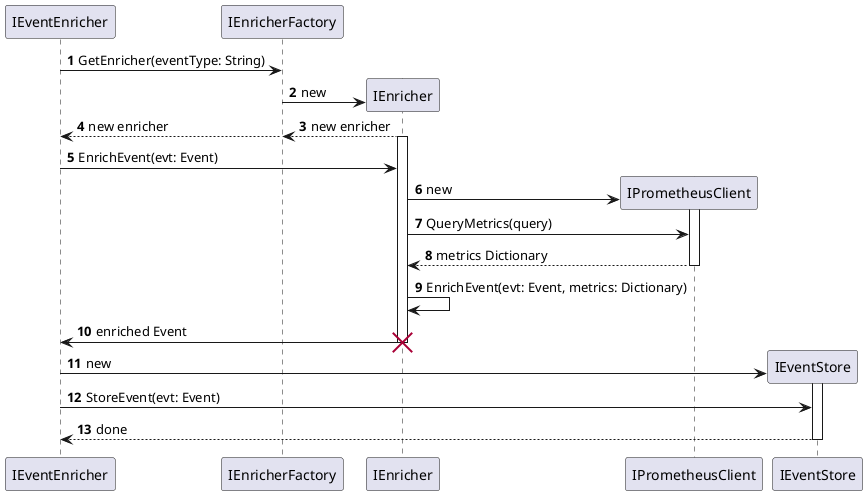
This sequence diagram illustrates the flow of enriching an event with metrics and storing it. Here's a breakdown of the components and their interactions:
Participants
| Interface | Role |
|---|---|
| IEventEnricher | Initiates the event enrichment process |
| IEnricherFactory | Provides an appropriate enricher for event type |
| IEnricher | Performs enrichment with metrics |
| IPrometheusClient | Queries metrics |
| IEventStore | Stores the enriched event |
Key Concepts
- Factory Pattern:
IEnricherFactorydynamically provides anIEnricherbased on the event type. - Dependency Injection:
IEnricherinternally creates and usesIPrometheusClient. - Lifecycle Management: Objects like
IEnricher,IPrometheusClient, andIEventStoreare created and destroyed as needed. - Encapsulation: Each participant handles its own responsibilities without leaking internal logic.
Primary Execution Flow
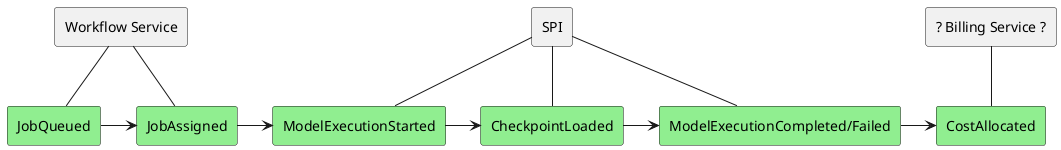
This diagram illustrates primary event execution flow. Workflow service is responsible for generating JobQueued and JobAssigned events. XUMI is responsible for generating ModelExecutionStarted, CheckpointLoaded, ModelExecutionCompeted or ModelExecutionFailed events. BillingService is responsible for generating CostAllocated event.