How to Process Reported Issue
A starting guide for support engineers
Open the Story Behind the Issue
When a user reports a problem in Craftology, the description they provide is only part of the picture.
The real depth comes from the PostHog session replay link attached to the ticket in YouTrack.
Opening that link brings you into a dedicated replay interface. At first glance, it may look like a simple recording — but it’s much more than that.
You’re not just watching what happened. You’re stepping into the user’s exact experience.
Understand the Posthog Interface
The screen is divided into a few key areas, each telling part of the story.
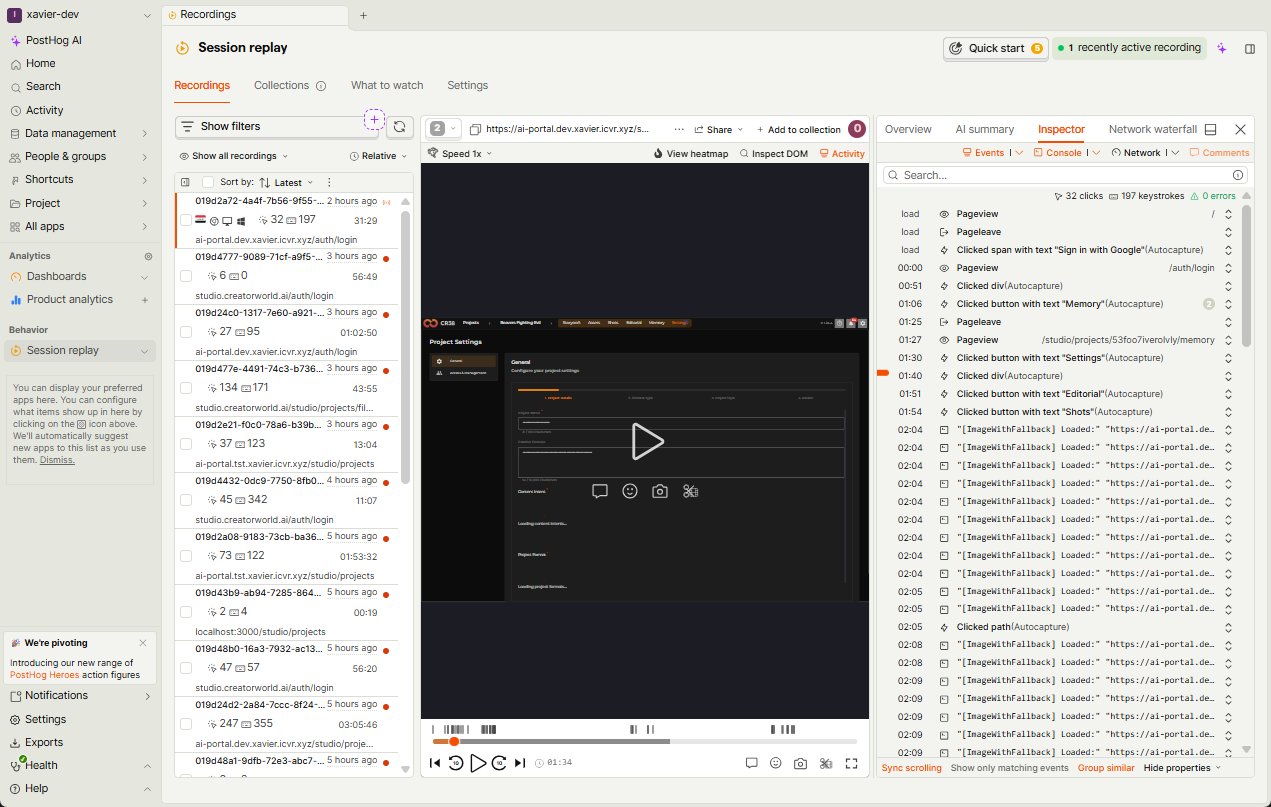
On the left, you’ll see a list of recordings. These represent user sessions across the platform. The one linked in the ticket is already selected, placing you directly in the relevant moment.
In the center, the session playback appears. This is where you can watch the user navigate through Craftology — clicks, movements, interactions — all captured as they happened.
On the right, things become more analytical.
Here, PostHog shows a structured timeline of events:
- Page views and navigation
- Clicks and UI interactions
- System-triggered events
- Console and network activity
This is where the replay transforms from a video into a diagnostic tool.
Read the Replay Like a Narrative
Start by pressing play.
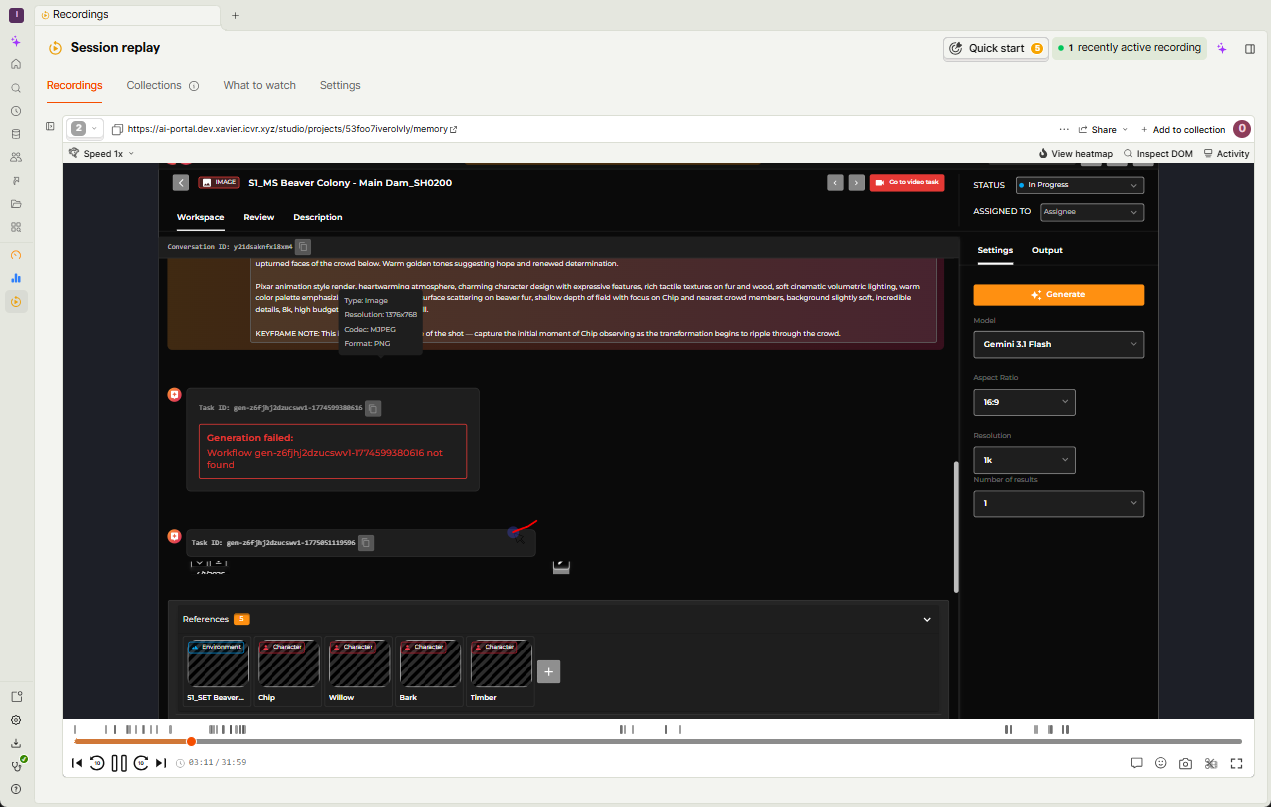
Watch the session from the beginning, without jumping ahead. Let the flow unfold naturally.
Pay attention to intent:
- What was the user trying to do?
Then observe behavior:
- Where did they click?
- Did the interface respond as expected?
And finally, identify the break:
- At what exact moment does something stop working?
Often, the issue becomes visible before you even look at logs.
Use the Event Timeline
Once you’ve seen the issue visually, shift your attention to the right-hand panel.
This is where precision begins.
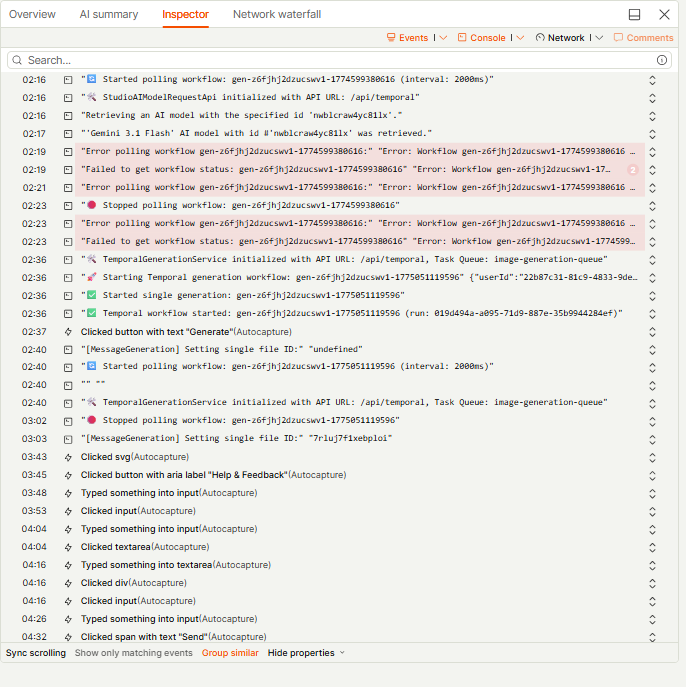
Each interaction is logged as an event. You can click through them to:
- Jump to specific moments in the session
- Inspect what triggered a change
- Identify missing or failed actions
For example, you might see:
- A button click with no follow-up request
- A page transition that never completes
- Repeated UI events without backend response
You can also explore console logs and network activity directly from this panel, which often reveals underlying errors.
Connect Replay with the Ticket
Compare what you see in the replay with the user’s original report in YouTrack.
Sometimes they align perfectly. Sometimes the replay reveals something the user didn’t notice.
This is where your role becomes interpretive.
You’re not just confirming the issue - you’re understanding it from both perspectives:
- The user’s experience
- The system’s behavior
From Observation to Action
Once the issue is clear, you can begin to act.
You might:
- Identify a frontend issue (UI not responding)
- Spot a backend failure (missing or failed request)
- Recognize a workflow interruption (generation stopped mid-process)
If needed, you can combine insights from:
- The replay
- Attached logs
- The contextual data in the ticket
Together, they form a complete diagnostic picture.
Reading Logs: Find the Root Cause
When a user attaches a session log to their report, you’re no longer relying only on what you see. You gain access to what the system experienced internally.
At first glance, a log file may look dense or overly technical. But with a bit of structure, it becomes one of the most reliable sources of truth.
Attached Log File
[2026-04-01T13:44:59.018Z] [LOG] 🛠️ StudioAIModelRequestApi initialized with API URL: /api/temporal
[2026-04-01T13:44:59.020Z] [LOG] Retrieving the list of AI models of type 'image'.
[2026-04-01T13:44:59.369Z] [WARN] unsubscribeFromReviewItems is deprecated. Use the unsubscribe function returned by subscribeToReviewItems instead.
[2026-04-01T13:44:59.480Z] [LOG] 7 of AI models were retrieved.
[2026-04-01T13:45:00.145Z] [LOG] [MessageGeneration] Setting single file ID:
[2026-04-01T13:45:00.146Z] [LOG] 🛠️ TemporalGenerationService initialized with API URL: /api/temporal, Task Queue: image-generation-queue
[2026-04-01T13:45:00.148Z] [LOG]
[2026-04-01T13:45:00.149Z] [LOG] 🔄 Started polling workflow: gen-z6fjhj2dzucswv1-1774599380616 (interval: 2000ms)
[2026-04-01T13:45:00.309Z] [LOG] 🛠️ StudioAIModelRequestApi initialized with API URL: /api/temporal
[2026-04-01T13:45:00.311Z] [LOG] Retrieving an AI model with the specified id 'nwblcraw4yc81lx'.
[2026-04-01T13:45:00.767Z] [LOG] 'Gemini 3.1 Flash' AI model with id #'nwblcraw4yc81lx' was retrieved.
[2026-04-01T13:45:02.488Z] [ERROR] Failed to get workflow status: gen-z6fjhj2dzucswv1-1774599380616 {"statusCode":404,"error":"Not Found","details":null,"code":null}
[2026-04-01T13:45:02.489Z] [ERROR] Error polling workflow gen-z6fjhj2dzucswv1-1774599380616: {"statusCode":404,"error":"Not Found","details":null,"code":null}
[2026-04-01T13:45:04.477Z] [ERROR] Failed to get workflow status: gen-z6fjhj2dzucswv1-1774599380616 {"statusCode":404,"error":"Not Found","details":null,"code":null}
[2026-04-01T13:45:04.478Z] [ERROR] Error polling workflow gen-z6fjhj2dzucswv1-1774599380616: {"statusCode":404,"error":"Not Found","details":null,"code":null}
[2026-04-01T13:45:06.424Z] [ERROR] Failed to get workflow status: gen-z6fjhj2dzucswv1-1774599380616 {"statusCode":404,"error":"Not Found","details":null,"code":null}
[2026-04-01T13:45:06.424Z] [ERROR] Error polling workflow gen-z6fjhj2dzucswv1-1774599380616: {"statusCode":404,"error":"Not Found","details":null,"code":null}
[2026-04-01T13:45:06.424Z] [LOG] 🛑 Stopped polling workflow: gen-z6fjhj2dzucswv1-1774599380616
[2026-04-01T13:45:19.595Z] [LOG] 🛠️ TemporalGenerationService initialized with API URL: /api/temporal, Task Queue: image-generation-queue
[2026-04-01T13:45:19.597Z] [LOG] 🚀 Starting Temporal generation workflow: gen-z6fjhj2dzucswv1-1775051119596 {"userId":"22b87c31-81c9-4833-9de0-b9a7da58a54b","projectId":"53foo7iverolvly","cardId":"z6fjhj2dzucswv1","workflowId":"gen-z6fjhj2dzucswv1-1775051119596","workflowType":"ImageGenerationWorkflow","taskQueue":"image-generation-queue","conversationId":"y21dsaknfxi8xm4"}
[2026-04-01T13:45:20.242Z] [LOG] ✅ Temporal workflow started: gen-z6fjhj2dzucswv1-1775051119596 (run: 019d494a-a095-71d9-887e-35b9944284ef)
[2026-04-01T13:45:20.242Z] [LOG] ✅ Started single generation: gen-z6fjhj2dzucswv1-1775051119596
[2026-04-01T13:45:23.830Z] [LOG] [MessageGeneration] Setting single file ID:
[2026-04-01T13:45:23.830Z] [LOG] 🛠️ TemporalGenerationService initialized with API URL: /api/temporal, Task Queue: image-generation-queue
[2026-04-01T13:45:23.831Z] [LOG]
[2026-04-01T13:45:23.831Z] [LOG] 🔄 Started polling workflow: gen-z6fjhj2dzucswv1-1775051119596 (interval: 2000ms)
[2026-04-01T13:45:46.288Z] [LOG] 🛑 Stopped polling workflow: gen-z6fjhj2dzucswv1-1775051119596
[2026-04-01T13:45:46.590Z] [LOG] [MessageGeneration] Setting single file ID: 7rluj7f1xebploi
Follow the Flow of Events
A good way to approach any log is to read it as a timeline. Each entry is timestamped, which means you can follow the sequence of events exactly as they happened during the user’s session.
In this case, the log begins with normal activity. Images being successfully loaded into the interface:
[LOG] [ImageWithFallback] Loaded: ...:contentReference[oaicite:0]{index=0}
This tells you that the system is functioning correctly at first. The UI is rendering content, assets are being retrieved, and nothing is failing yet.
This is important because it establishes a baseline of normal behavior.
Identify the Start of the Workflow
A bit further down, you begin to see the system preparing for generation:
- The model is retrieved (Gemini 3.1 Flash)
- The generation service is initialized
- A workflow starts polling
This is the moment where the user action (clicking “Generate”) translates into backend activity.
You’ll notice a workflow ID appearing:
This ID becomes your anchor. Everything that follows relates to this specific generation attempt.
Spot the Failure
Shortly after the workflow starts, the log reveals a repeating pattern:
Failed to get workflow status ... "statusCode":404, "error":"Not Found":contentReference[oaicite:1]{index=1}
This is the turning point.
Instead of progressing, the system is repeatedly trying to retrieve the workflow status and failing.
The 404 Not Found error tells you something very specific:
- The frontend expects the workflow to exist
- The backend cannot find it
This usually points to one of a few root causes:
- The workflow was never properly created
- It was created but lost or expired immediately
- There is a mismatch between frontend and backend IDs
As the errors repeat, the system eventually stops polling:
Stopped polling workflow:contentReference[oaicite:2]{index=2}
At this moment, from the user’s perspective, generation simply “does nothing.”
Recognize Recovery or Retry Behavior
Interestingly, the log doesn’t end there.
A new workflow starts shortly after:
This indicates that the system (or user) attempted another generation.
This time the workflow starts successfully, generation begins and polling resumes. However, the polling stops again without a clear success message.
This suggests a second issue:
- Either the workflow completes silently
- Or the result is not returned to the UI properly
What This Tells You as Support
From this single log, you can reconstruct the entire issue:
The user attempted to generate an image. The system initiated the workflow correctly, but the backend could not track or retrieve the workflow state (404 error). As a result, the frontend stopped waiting, and the user saw no output.
This is no longer a vague “generation failed” report. It becomes a precise technical scenario:
- Workflow creation inconsistency
- Broken status polling
- Potential backend synchronization issue
Connect Logs with Replay
Now, combine this with PostHog replay.
In the replay, you might see:
- The user clicking “Generate”
- No visible result appearing
In the logs, you now know why:
- The workflow was not found
This is where logs and replay complement each other:
- Replay shows the experience
- Logs explain the cause
Turn Insight into Action
With this understanding, you can respond with clarity.
You might:
- Confirm that the issue is backend-related
- Provide a workaround (retry generation)
- Escalate with exact workflow IDs for investigation
Most importantly, you avoid guesswork.
You’re no longer asking:
“Can you describe what happened again?”
You’re saying:
“We see that your generation workflow could not be retrieved due to a 404 error. We’re investigating why this occurred.”
What Happens Next: Responding and Escalating
Once you’ve gone through the replay and the logs, the investigation doesn’t end there. The final step is just as important as the analysis itself, it closes the loop with the user and makes sure the issue moves forward internally.
At this point, you already understand what happened. The next goal is to communicate that clearly and take action.
Respond in YouTrack
Every report submitted from Craftology becomes a YouTrack issue, and this is where your response reaches the user.
When you open the ticket, you’ll see the full context: the user’s description, environment details, replay links, and any attached logs. Based on your investigation, you should add a comment directly to the issue.
This comment is not just internal, it is sent to the user via email. It becomes their primary source of feedback.
A good response should feel reassuring and specific. Instead of repeating generic phrases, explain what you found in simple terms:
“We’ve reviewed your request and identified that the generation workflow could not be retrieved due to a backend error. This is why no result was produced.”
Even if the issue is not yet resolved, the user should feel that:
- their report was understood
- their time was not wasted
- someone is actively working on it
If there’s a workaround (for example, retrying generation), include it naturally in your response. If not, it’s perfectly fine to say that the issue has been escalated.
Keep the User in the Loop
Once your comment is added, the system automatically notifies the user via email. They can reply directly or follow the link back to the ticket.
From that moment on, the issue becomes a shared thread between support and the user.
If new findings appear, whether from developers or further investigation, update the same ticket. This continuity is important. It keeps everything in one place and avoids fragmented communication.
Escalate to Developers
When the issue goes beyond configuration or user guidance, it needs to be escalated.
By the time you escalate, you’ve already done the most valuable part:
- reproduced or understood the issue through replay
- identified failure points in the logs
- collected workflow IDs, timestamps, and environment data
This means your escalation is not just “something is broken,” but a well-formed technical case.
Inside YouTrack, you can:
- assign the issue to the appropriate developer or team
- adjust the priority if the impact is significant
- add a technical summary in a comment
A strong escalation comment connects all the pieces:
- what the user experienced
- what replay shows
- what logs confirm
- where the failure likely occurs
For example, you might summarize:
“User attempted image generation. Replay confirms no output. Logs show repeated 404 errors when polling workflow
gen-..., suggesting workflow state is not available on backend.”
This level of clarity allows developers to move straight into investigation without needing to reconstruct the problem from scratch.